The Paititi Research project represents the culmination of efforts by an independent, interdisciplinary team of researchers dedicated to unlocking the mysteries of Peruvian history. The authors made this study as their independent work, not affiliated with any organization, and not receiving any external financial support. To get more technical details, see: C. Cieslar and Y. Vasyunin, “Identification of archeological sites in the Peruvian Amazon using satellite remote sensing.” Unpublished, 2023.
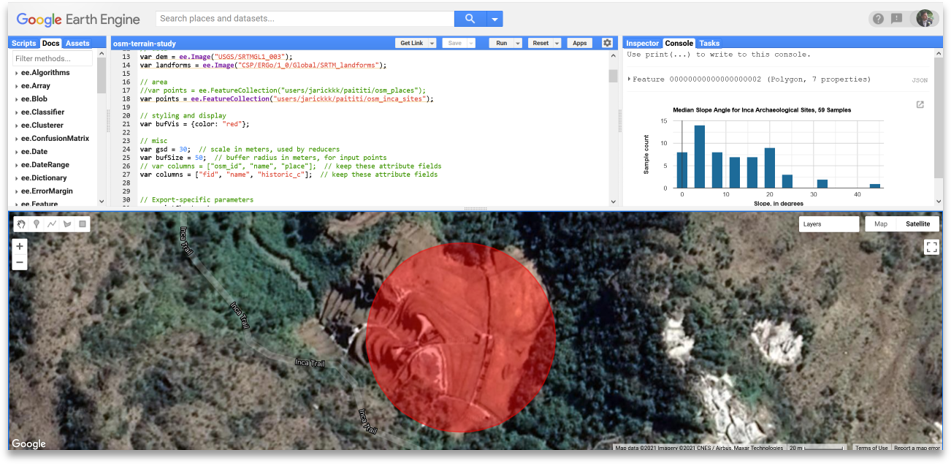
We developed a cloud GIS infrastructure for multi-user work on the project and integrated ERS imagery with various geospatial data sets, such as digital elevation models (DEM) and historical maps. A novel predictive technique that allows detecting areas suitable for ancient settlements is put into action based on GEE scripts, open to the public. The most prominent areas are manually studied using the available imagery and maps, which reveal marks that could indicate archaeological sites.
Project Context
There is a scarce theoretical development in the archaeological studies in the Peruvian Amazon. The little relevance granted to this geographical area would be, firstly, due to the low visibility of the archaeological sites, and, secondly, due to complicated conditions of life, transfer, stay, and work [1].
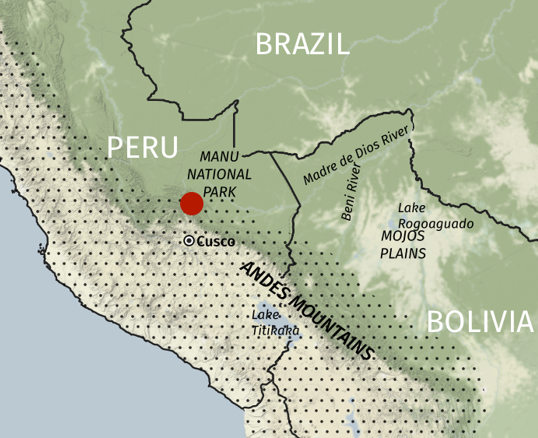
A heavily forested, mountainous, and almost uninhabited territory in the Manu National Park in Peru, between Cusco and Madre de Dios regions, could have potentially acted as a barrier and corridor for human societies through time, considering its relevant vicinity to the core of the Inca state.
Two historic Jesuits’ manuscripts [2], [3] and several recent testimonies [4]–[7] point to the high-altitude selva, rain forest of southeast Peru, as to the place where a settlement (or settlements) of some developed culture may exist.
Multiple expeditions attempted to find Paititi before us. Here, we share our opinion on why they failed or had little success and how current technology gives us an advantage:
- Lack of High-Resolution Satellite Imagery: One of the most critical limitations faced by earlier expeditions was the unavailability of high-resolution satellite images. This modern tool allows for the identification of anomalies and potential archaeological sites from above, providing invaluable guidance for ground teams.
- Inaccurate Historical Data: Many past explorations relied on historical documents and legends that were often vague or inaccurately interpreted. Without precise locations or descriptions, these expeditions could only guess where Paititi might be located, leading to extensive searches in the wrong areas.
- Advantage of Modern Technology: Our team leverages the latest in high-resolution satellite imagery, allowing us to pinpoint areas of interest with far greater accuracy than ever before. This technology provides us with detailed topographical maps and has revealed patterns and structures obscured by the jungle canopy, guiding our ground searches more effectively.
- Interdisciplinary Approach: Combining the high-resolution satellite data with expertise from various fields enables a more informed and strategic search.
Methodology and Data
GIS infrastructure
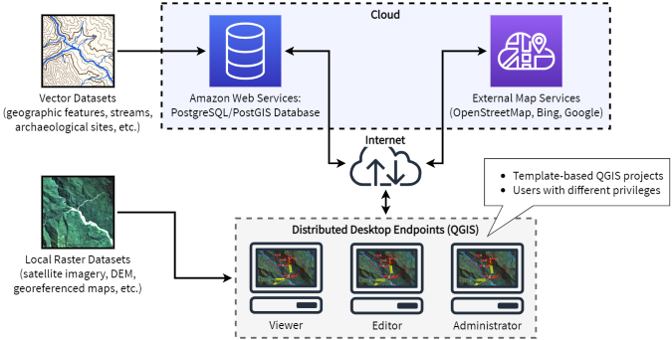
As the research team was scattered worldwide, this study’s first step was creating a GIS that enables simultaneous work on geospatial layers.
Our spatial infrastructure’s core became the Relational Database Service (RDS) platform from Amazon, allowing cost-effective and straightforward configuration, use, and scaling of relational databases in the cloud.
The platform is equipped with an open-source RDBMS PostgreSQL with the PostGIS extension to work with spatial data.
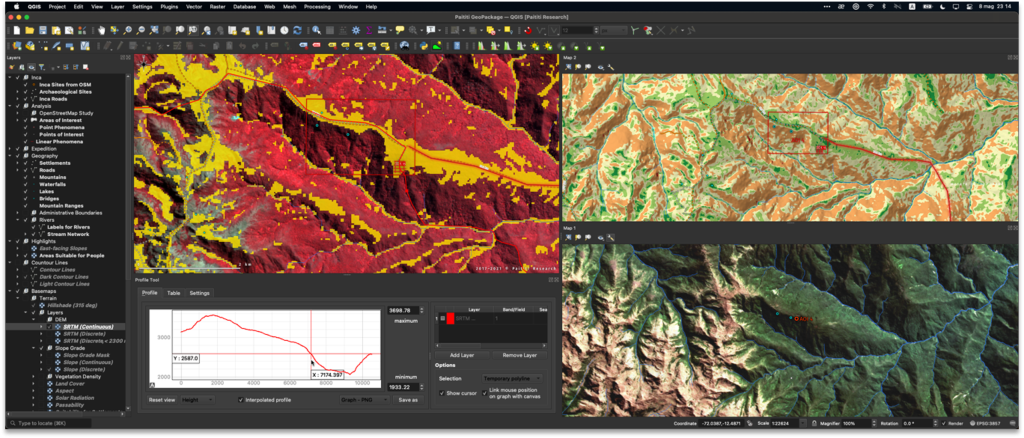
The front end for interacting with geospatial information in the database is the desktop open-source, cross-platform software QGIS.
Data collection and overview study
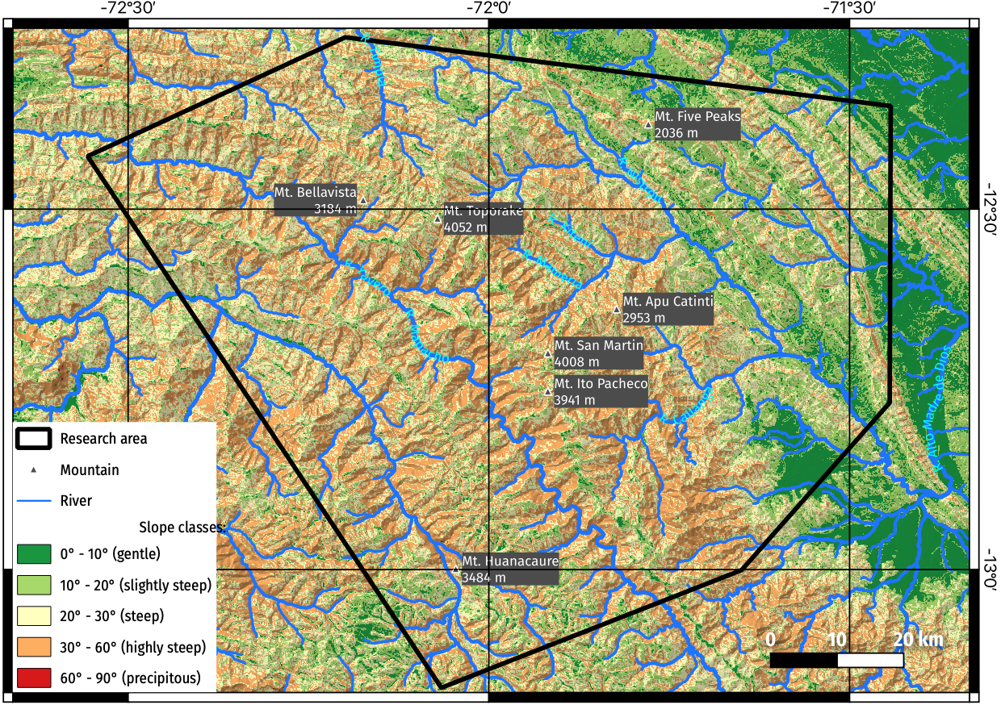
The research area extended over ca. 8,000 km², lies where the southeastern Peruvian Andes transitions to the rainforests of the Amazon basin, on the border between Cusco and Madre de Dios regions. Western mountainous side, sierra, varies in altitudes from 2,000 m to 4,000 m, covered chiefly by low grass and shrubs. Eastern mountain selva goes down to 1,000 m and has a very high density of woody vegetation — more than 75%.
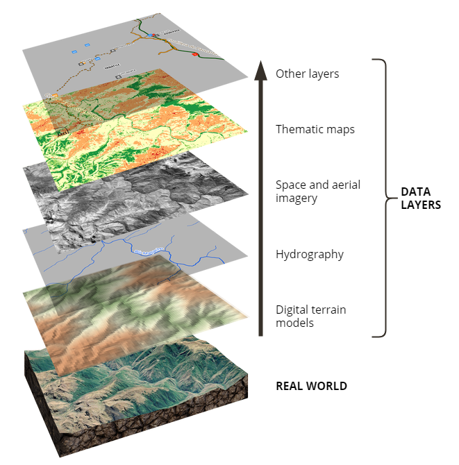
As in any project on the analysis of poorly studied, almost uncharted territories, work begins with collecting all available territorial data, which are then ingested in Geographic Information System (GIS). Thereupon, it becomes clear what methods of geospatial analysis apply to the data collected. All the data sets collected by authors fit into two groups by their map detail level. The overview level has moderate spatial resolution and covers the whole research region, while the detailed level with high spatial resolution clarifies only specific spots.
Primary datasets used in the research
Predicting modelling
We performed a preliminary study of well-known Inca ruins, such as Machu Picchu and Vilcabamba. They show relation to terrain morphology, namely slope that fits the range approx. 0-20˚.
To assure the derived conclusions, we assumed that the settling patterns of small modern local communities did not change significantly. We retrieved 15,738 samples of small modern Andean settlements from OpenStreetMap. For each point, we created a 50-meter-radius buffer and calculated terrain morphology values.
Based on the obtained relationship between slope and populated places in the Andes, we created a Slope Steepness / Settlement Suitability Map, which divides the entire study area into five distinct categories by slope steepness:
- gentle (0-10˚)
- slightly steep (10-20˚)
- steep (20-30˚)
- highly steep (30-60˚)
- precipitous (60-90˚)
Thus, the efforts to collect and analyze high-resolution remote sensing data were reduced from 8000 km² down to 2350 km².
High-resolution data interpretation
It is the human eye that can notice subtle marks in images, linking them with the surrounding context. A thorough visual interpretation of all available spatial data, specifically of high-resolution, became the basis of our research approach.
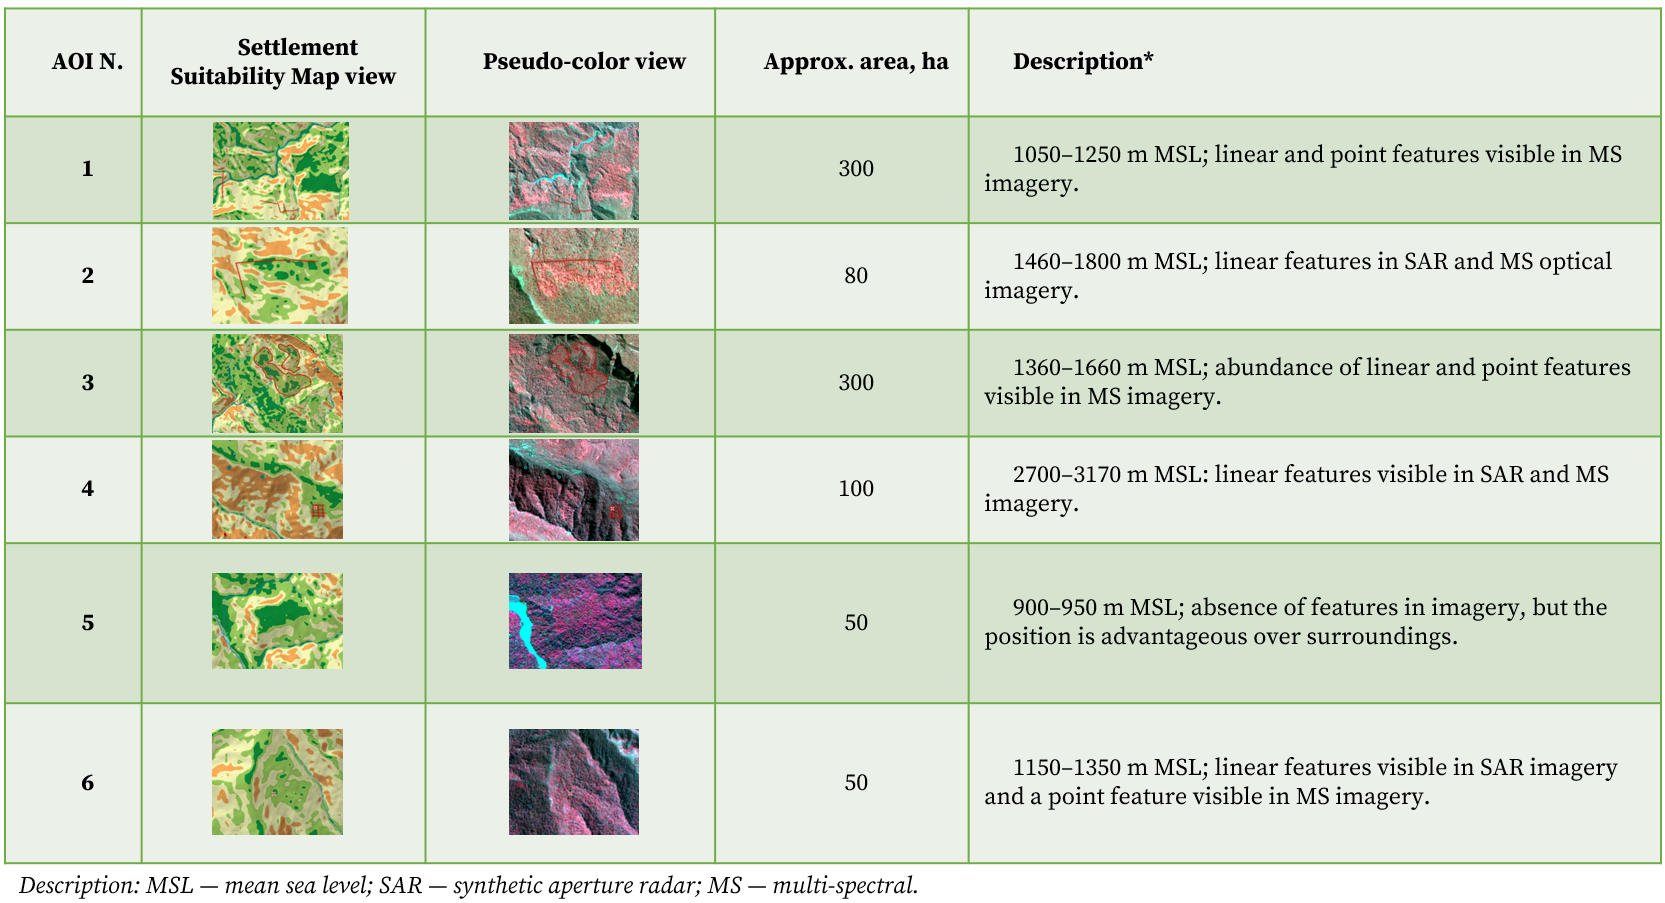
The criteria to identify potential unknown archaeological sites were the position in the basin of the Nistrón river, on terrain of highly suitable and suitable classes, a water source presence, and the dominant position over the surroundings.
We analyzed an area of about 3.000 km², with a particular focus on the highly-suitable areas, for which we have acquired high-resolution commercial data.
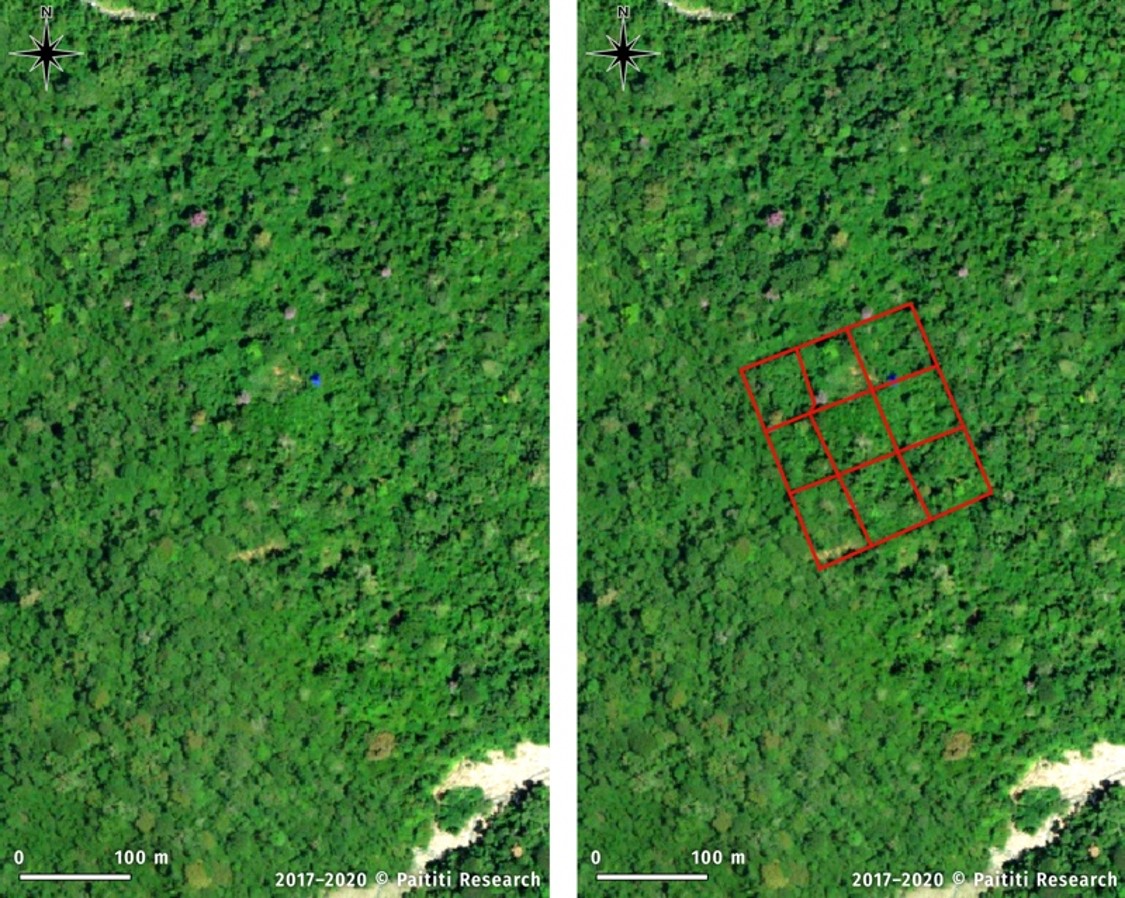
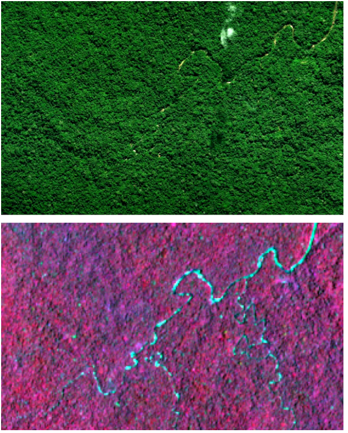
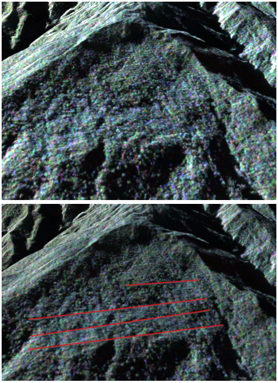
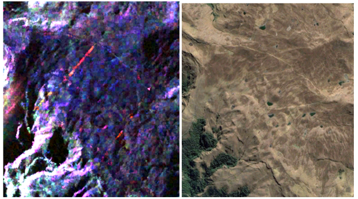
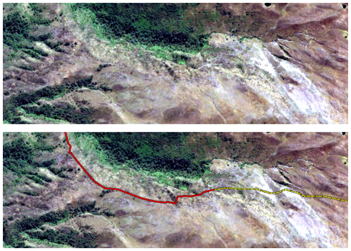
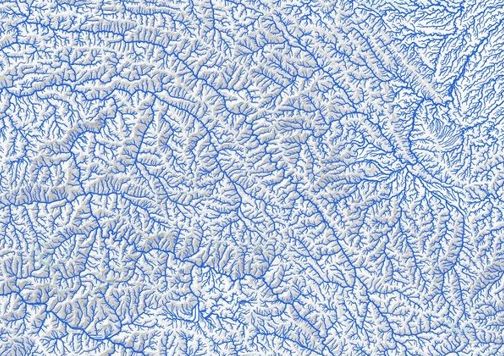
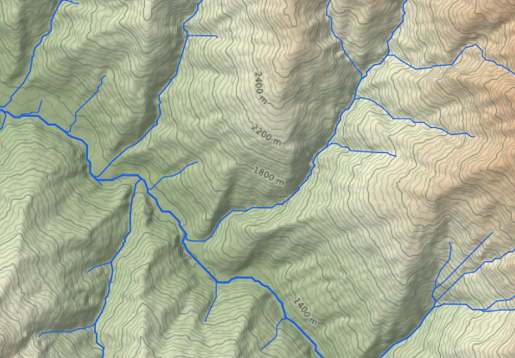
Six preliminary areas of interest (AOIs)
Testimonies analysis: Mapping
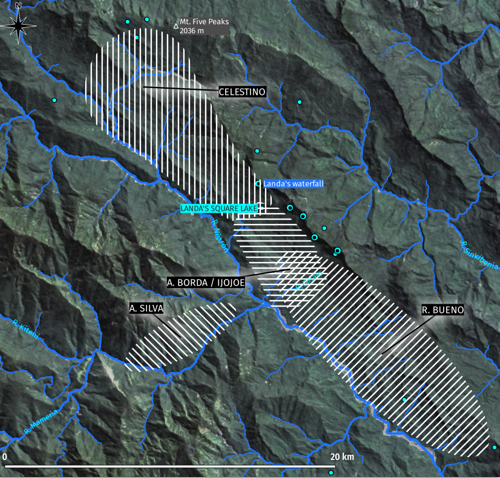
Until today, the only known large ancient settlement in the basin of the Madre de Dios river are the ruins of Mameria, discovered in the 1970s by Herbert Cartagena [5], [7, pp. 113–116]. However, there are a few unverified testimonies describing the existence of a larger settlement hidden in the selva of the Manu National Park. Such testimonies were reported by Landa [4, pp. 56, 19, 51–53, 57], and Palkiewicz & Kaplanek [6, p. 374].
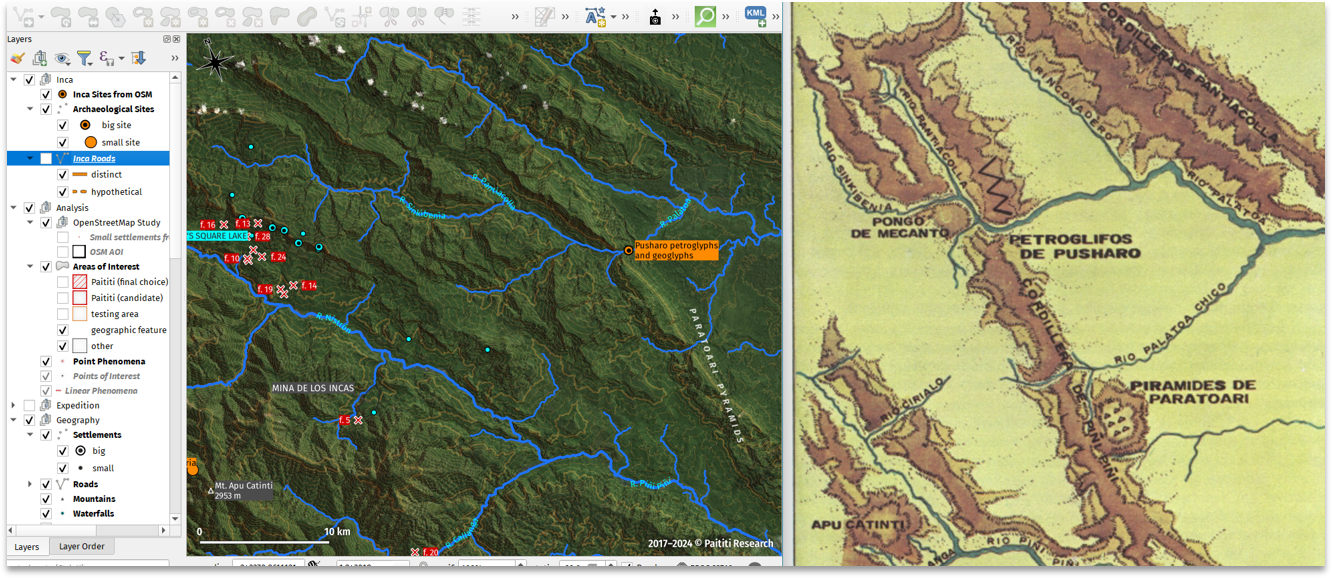
Where it was possible, we put the areas mentioned in the testimonies on a map to compare with the areas retrieved from our own geospatial analysis. They narrowed down the research area to the Nistron (Maestron) river basin in the western Manu National Park.
Testimonies analysis: Georeferencing of old maps
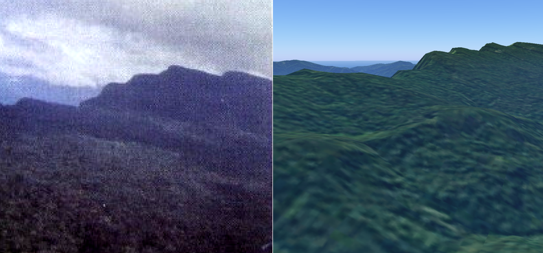
Testimonies analysis: Georeferencing of photographs
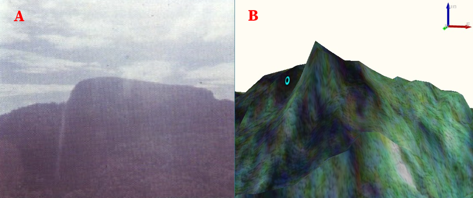
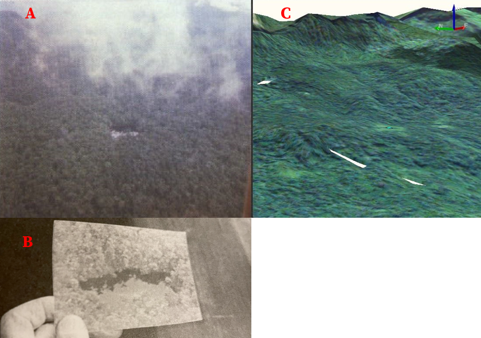
* Film photographs are originally made by Landa [4].
Putting all the pieces together
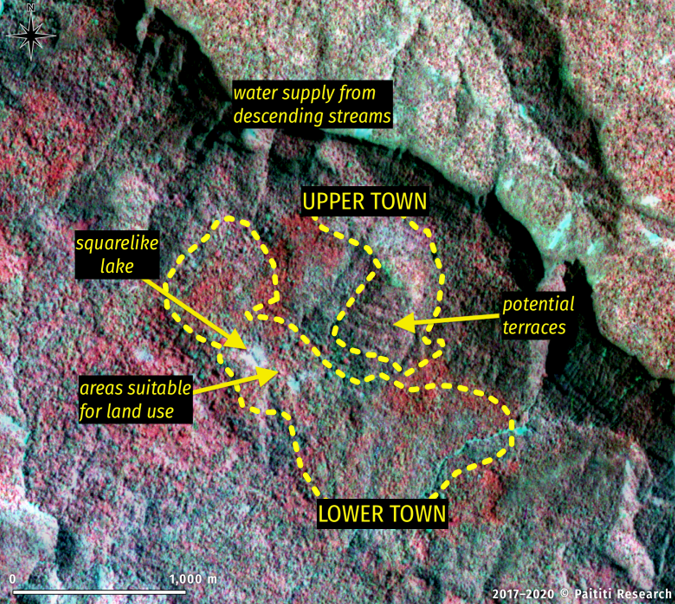
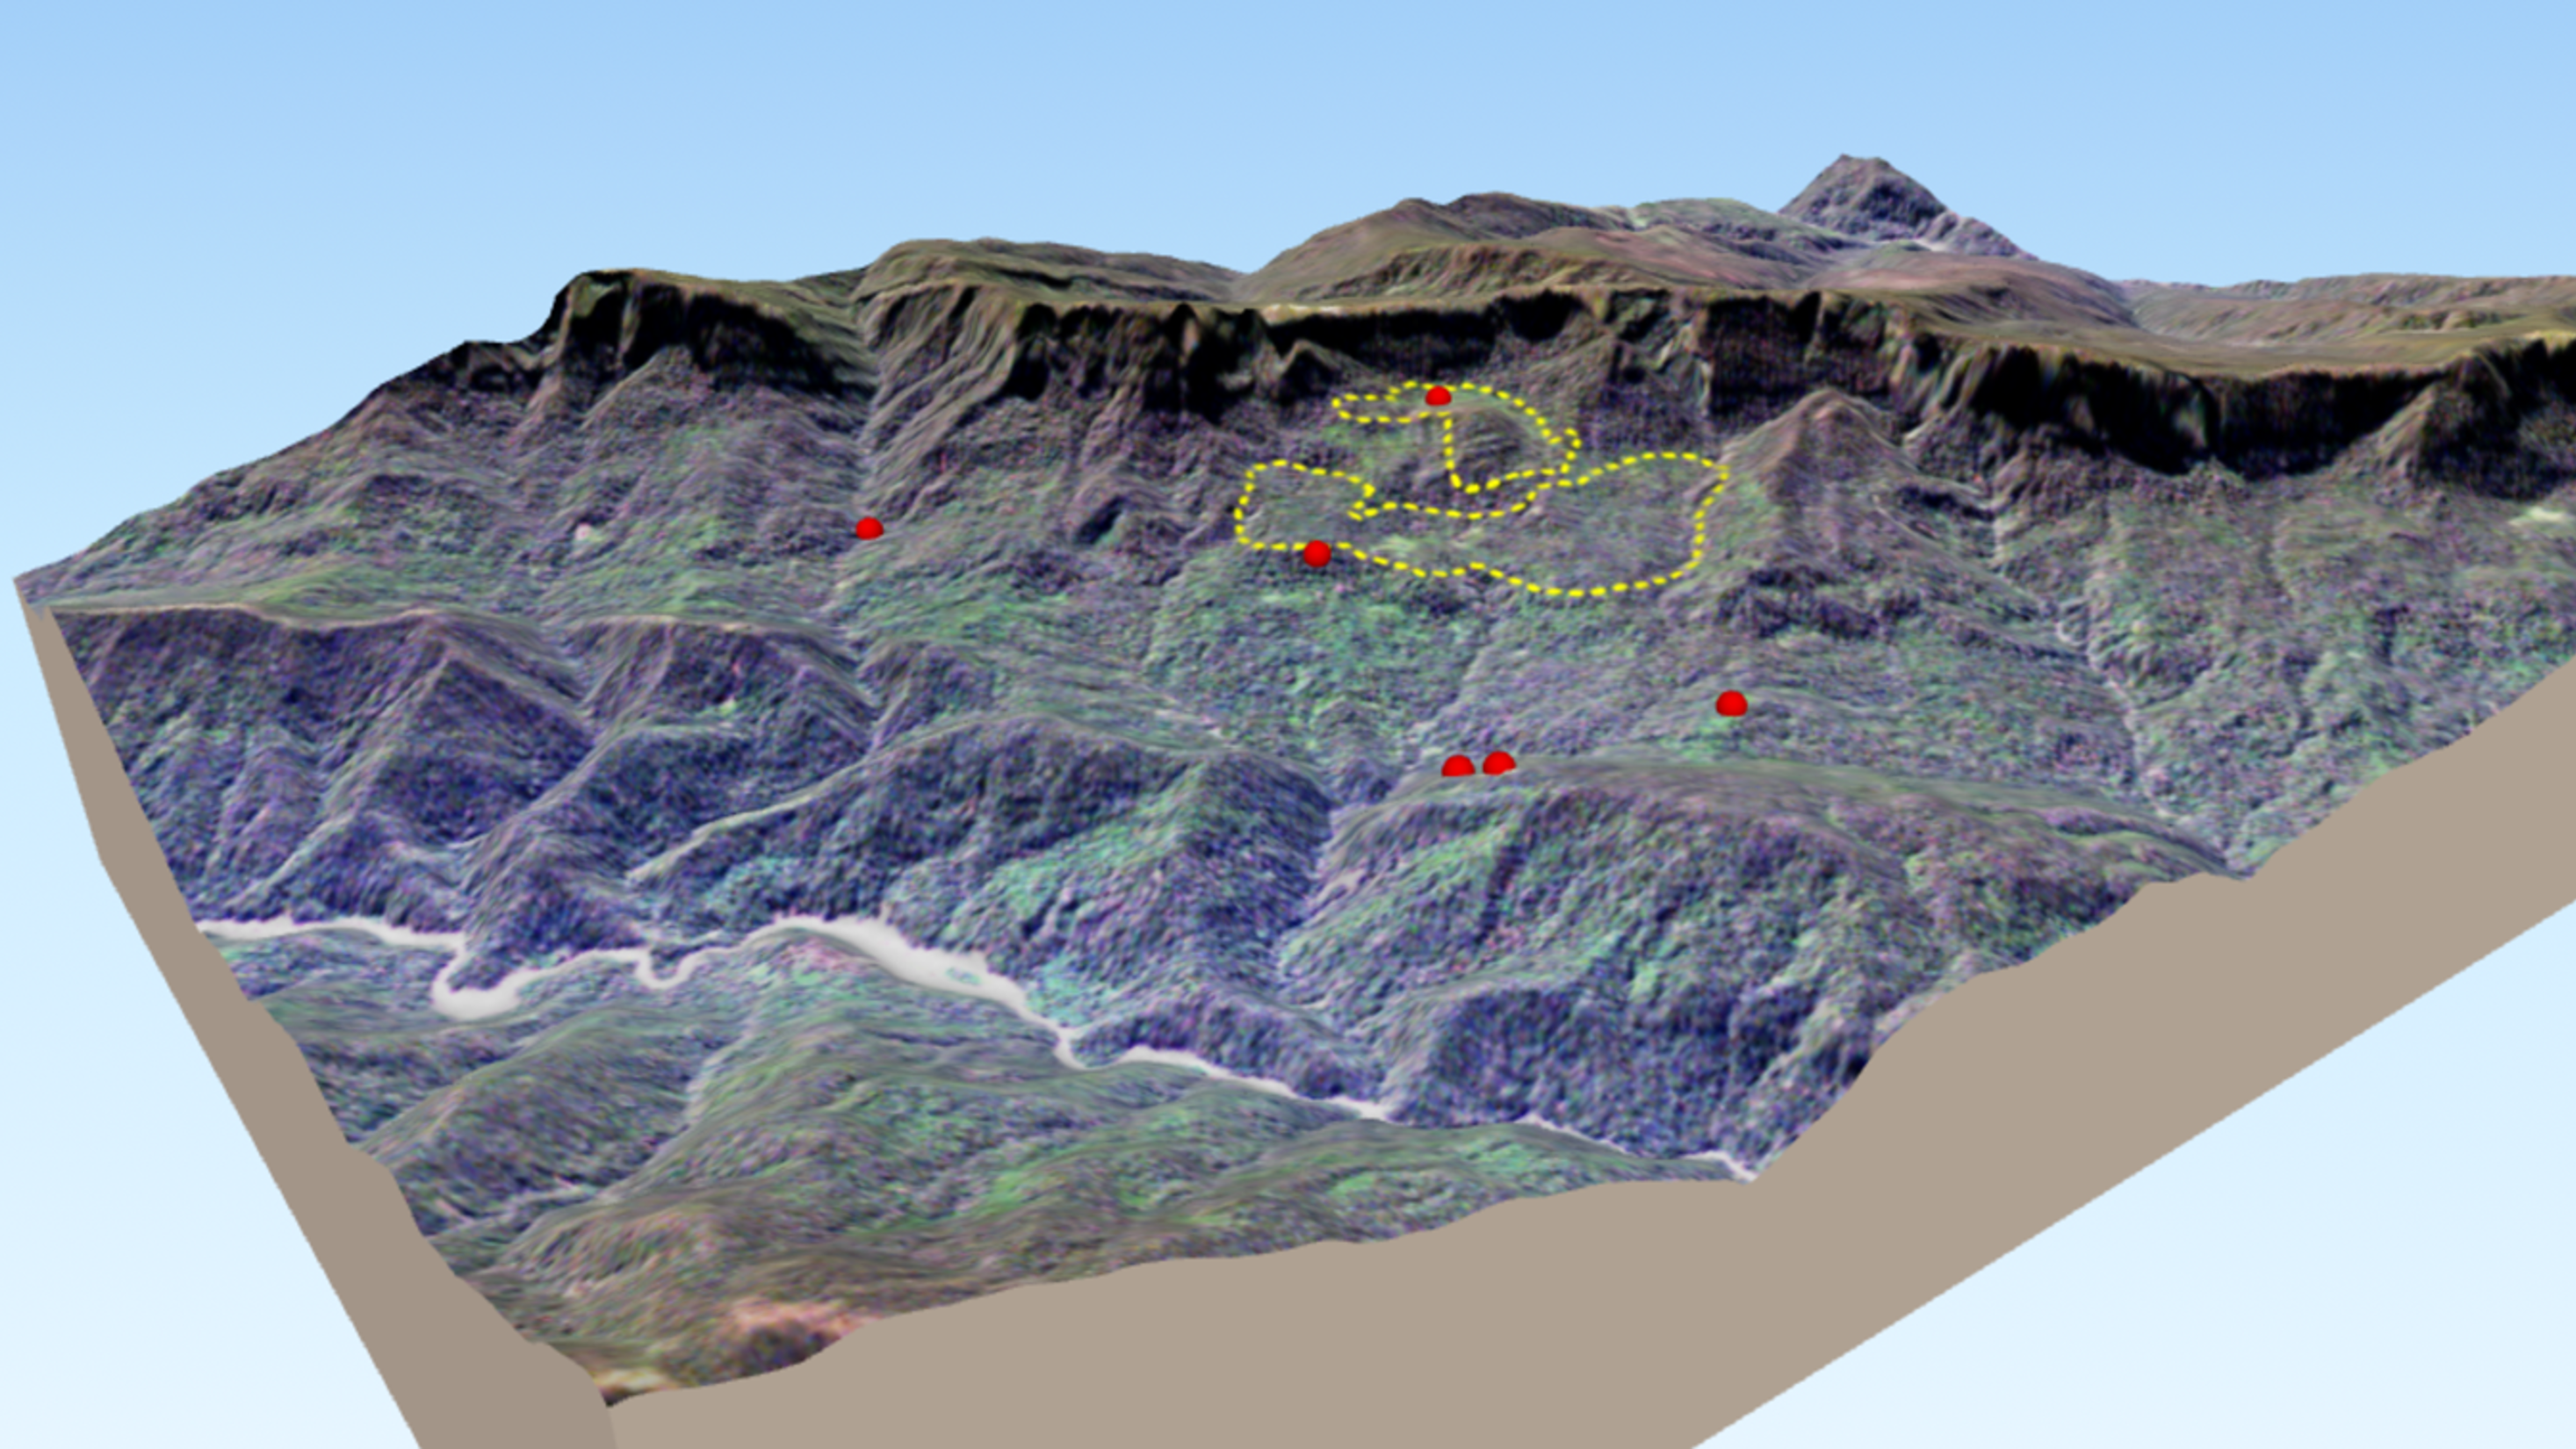
The AOI 3 turned to be the most promising site due to:
- Its position between all the areas described in the testimonies.
- Its correspondence to the photographs made by Landa and precisely georeferenced in our GIS.
- The presence of several recognized image features, visible in different spectral ranges.
- Favorable terrain conditions as it has a dominant position with mountains that limit its western part. It should provide natural protection, the abundance of waterfalls and water supply, as mentioned in several testimonies.
Results
Expedition 2019
By the end of May 2019, after spending almost three years on theoretical studies and selecting the most promising areas, we decided to take our first steps on the ground of Peru.
We checked the equipment and our capabilities under rough conditions, made conclusions about the efficiency of the maps we developed, and about the organization of a more complex expedition.
Conclusion
The further investigation of the Area of Interest 3, either by fieldwork activities or by an aerial lidar survey able to penetrate through thick vegetation, would be crucial in the verification of the results of this work, in the understanding of the settlement patterns on the eastern Andean side, and in the interaction between selva and sierra people.
In addition, the complete geospatial database of the vast, poorly mapped Peruvian area, created in this work, gives a unique holistic understanding of that environment. It is enabled by a GIS that connects researchers from different places in the world. On the one hand, the collected data brings value for future studies in the region, such as for the Manu National Park administration to preserve biodiversity. On the other hand, the developed open-source GIS workflow can be applied outside of this research area, and it is not limited to only archaeology.
References
- H. Tantaleán, “Un panorama de la teoría arqueológica en el Perú de comienzos del siglo XXI,” Discursos sur, no. 5, pp. 201–243, Jul. 2020, doi: 10.15381/dds.v0i5.18150.
- “Relazione d’un miracolo… nel Regno di Paÿtiti a canto del Perù [Report of a miracle… in the Kingdom of Paÿtiti near Peru],” Archivum Romanum Societatis Iesu, Perù, 19, ff. 38 41, 1567/1625.
- L. Laurencich-Minelli, “Traduzione in italiano del quaderno Exsul Immeritus Blas Valera Populo Suo [Italian translation of the notebook Exsul Immeritus Blas Valera Populo Suo],” in Exsul immeritus blas valera populo suo e Historia et rudimenta linguae piruanorum: Indios, gesuiti e spagnoli in due documenti segreti sul Perù del XVII secolo, CLUEB, 2005, pp. 307–340. doi: 10.1400/104366.
- C. N. Landa, Paititi en la bruma de la historia [Paititi in the mist of history]. Arequipa: Cuzzi, 1983.
- G. Deyermenjian, “Mameria: an Incan Site Complex in the High-Altitude Jungles of Southeast Peru,” Athena Review, vol. 3, no. 4, pp. 80–88, 2003.
- J. Palkiewicz and A. Kaplanek, El Dorado. Polowanie Na Legende [El Dorado. Hunt For The Legend]. Poznan: Wydawnictwo Zysk i S-ka, 2005.
- J. Edigo, Paititi – la ciudad perdida [Paititi – the lost city]. Lulu.com, 2017.


